Use Case
Xshield
What is it?
Xshield is ColorTokens’ micro-segmentation and Zero Trust security platform that enables organizations to visualize workloads and traffic across data centers, cloud, and hybrid environments. It provides the ability to segment applications and assets with fine-grained policies, enforce Zero Trust controls by only allowing authorized communication, and contain threats quickly by isolating compromised systems without disrupting business operations. In doing so, Xshield helps reduce attack surfaces and strengthens overall security posture.
Who is it for?
Xshield is for security and IT teams in enterprises that need to reduce attack surfaces, enforce Zero Trust policies, and stop threats from spreading across their data center, cloud, and hybrid environments.
Michael:
I want to quickly see how applications are communicating so I can segment them with confidence and stop threats from moving across our environment.
Story
Michael, an Enterprise Security Architect at a Fortune 500 company, is under pressure to strengthen security without disrupting business operations; he needs:
A clear view of the assets and overall risk posture.
To understand how the policies he created are shaping asset communication and confirm they’re strengthening security as intended.
Test policies so he can segment with confidence while keeping business operations running smoothly.
Design Solutions
Security Posture at a Glance
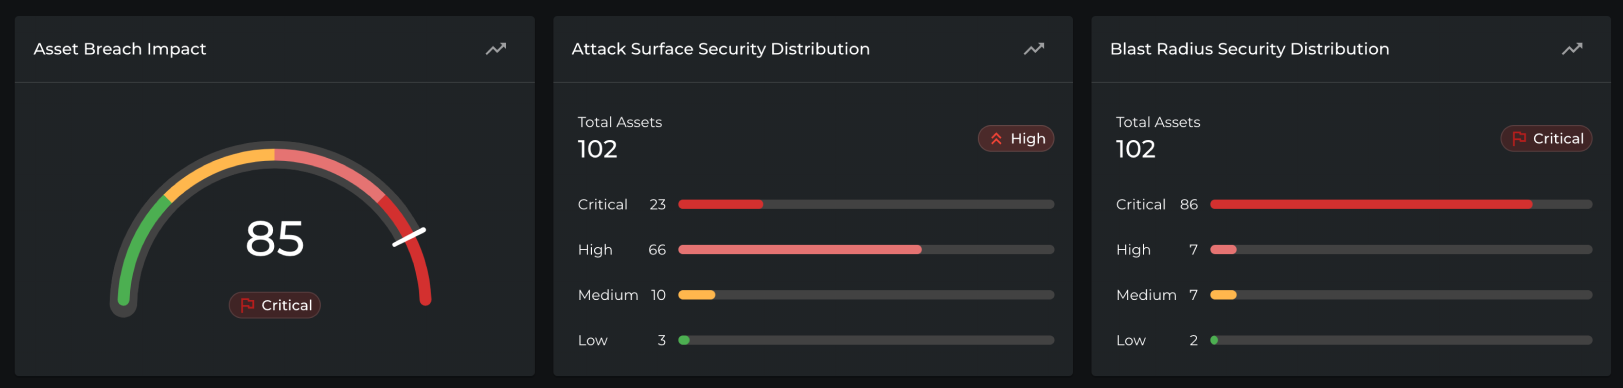
- Visibility of system status – The dashboard consistently displays breach impact scores and severity levels, ensuring Michael always has an up-to-date view of security posture.
- Match with real-world concepts – Clear, standardized labels (“Critical,” “High,” “Medium,” “Low”) and consistent color coding align with Michael’s mental model of risk.
- Recognition over recall – Visual gauges and distributions surface key insights directly, reducing cognitive load and allowing Michael to act without searching through raw data.
Policy Status
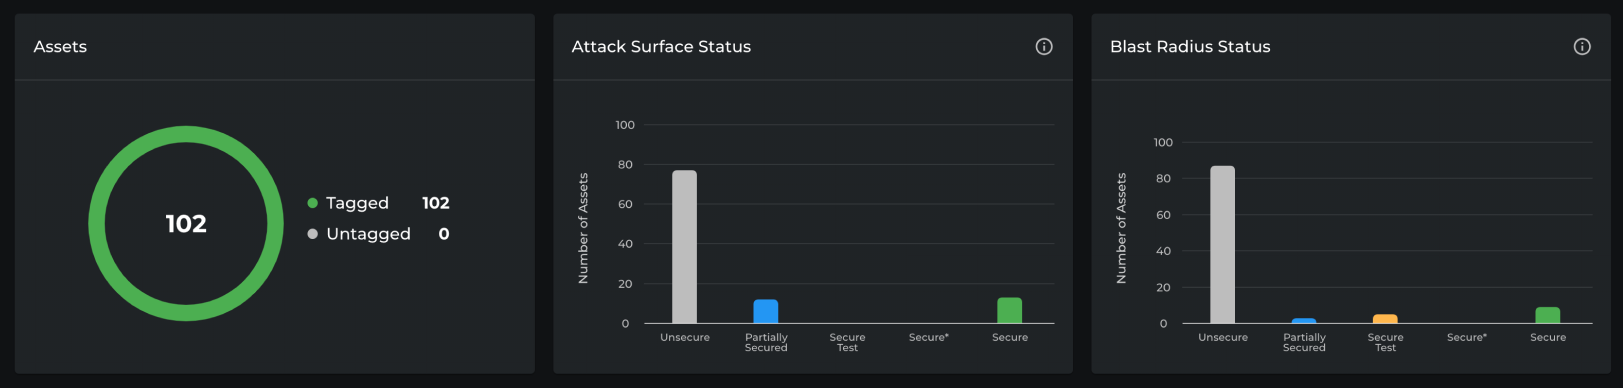
- Consistency and standards – Asset counts, status categories, and color coding are applied uniformly across all panels (Assets, Attack Surface Status, Blast Radius Status), so Michael doesn’t need to relearn patterns between views.
- Match with real-world concepts – Categories like “Unsecure,” “Partially Secured,” and “Secure” use terminology aligned with security operations, making it intuitive for Michael to interpret system posture.
- Recognition rather than recall – Donut and bar charts present the data visually, enabling Michael to recognize patterns and issues immediately without relying on memory or scanning raw tables.
Asset Risk Summary
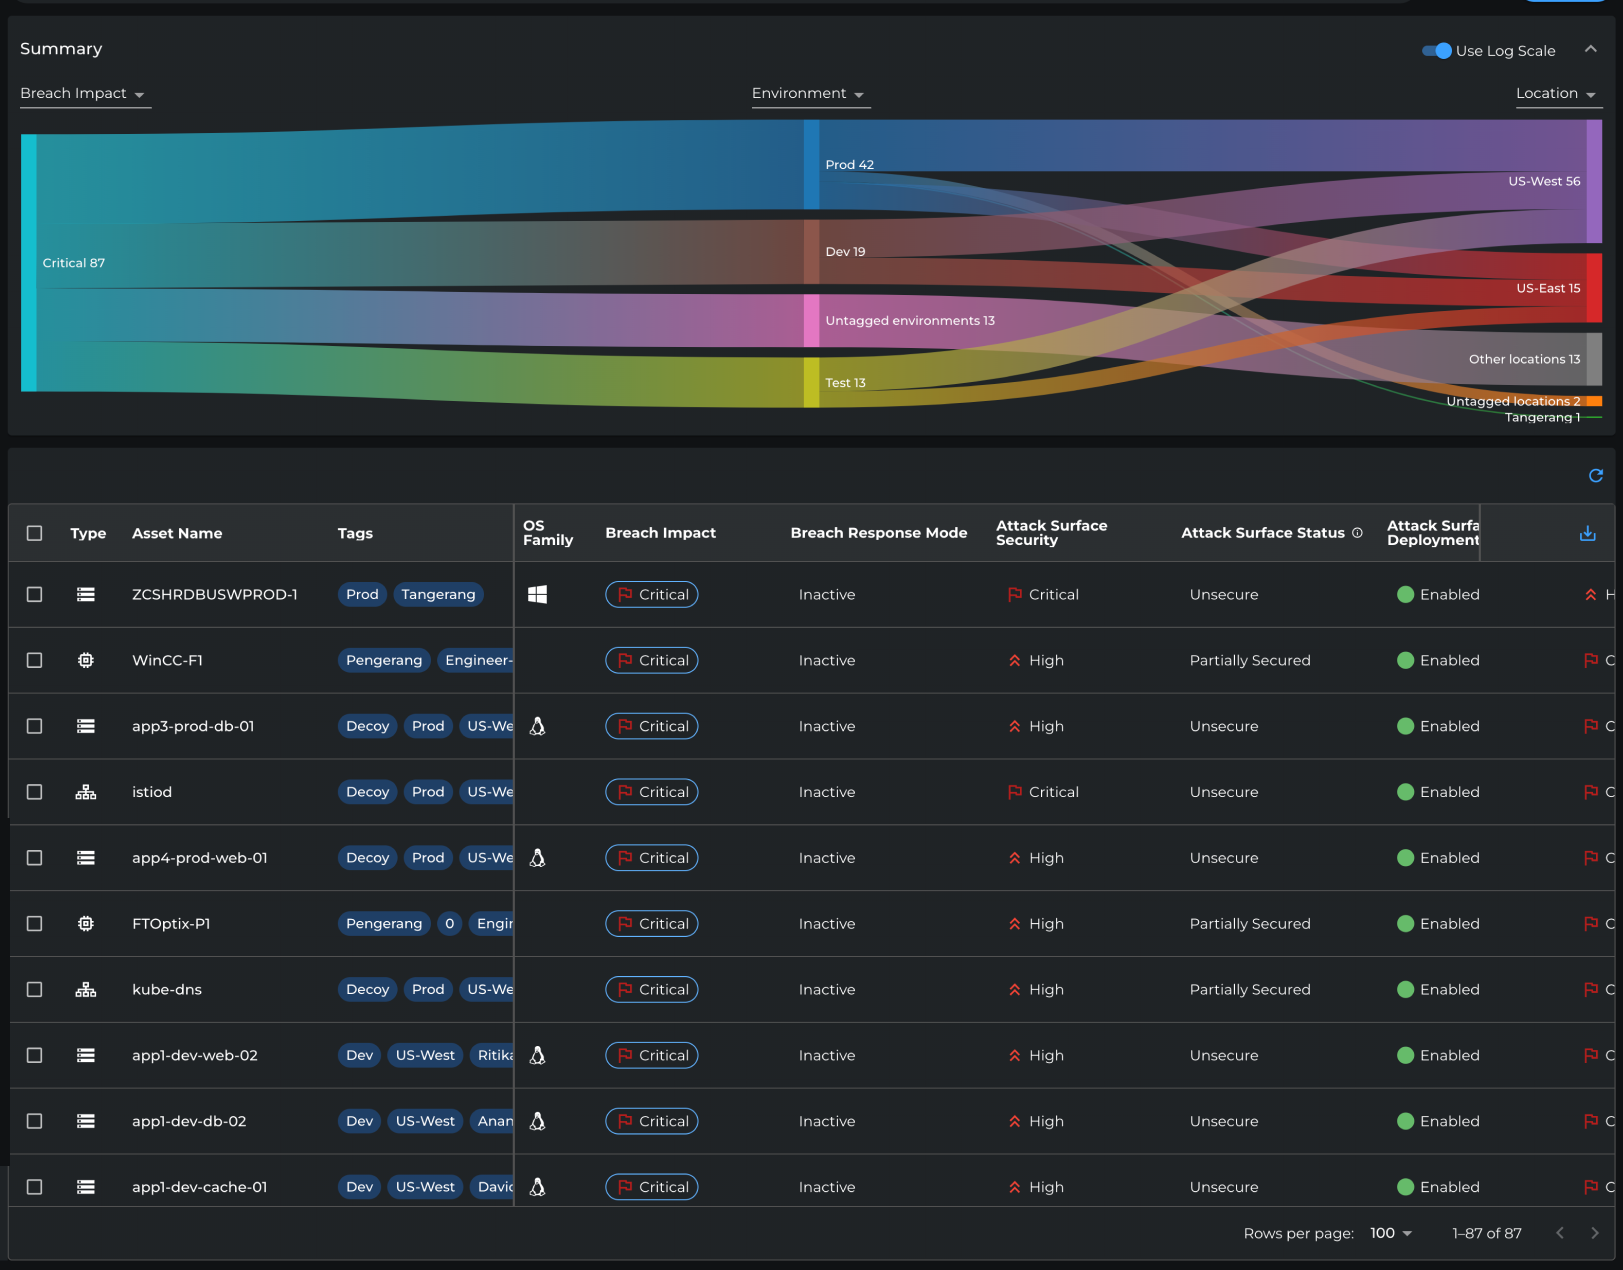
- Consistency and standards – The table uses uniform columns and standardized severity labels, making scanning efficient.
- Match with real-world concepts – Labels like “Critical,” and “Unsecure” reflect familiar security terms.
- Recognition over recall – Color-coded severity indicators and clear status tags allow Michael to identify risk patterns without digging into raw data.
- Flexibility of use – The UI supports both a high-level visualization (Sankey chart) and detailed asset-level insights (table), letting Michael move seamlessly from overview to specifics.
- Minimalist design – Only essential posture details are displayed, minimizing clutter and helping Michael focus on what requires action.
- Visibility of system status – The Sankey chart makes risk distribution across environments instantly clear.
Streamlined Policy Creation Flow
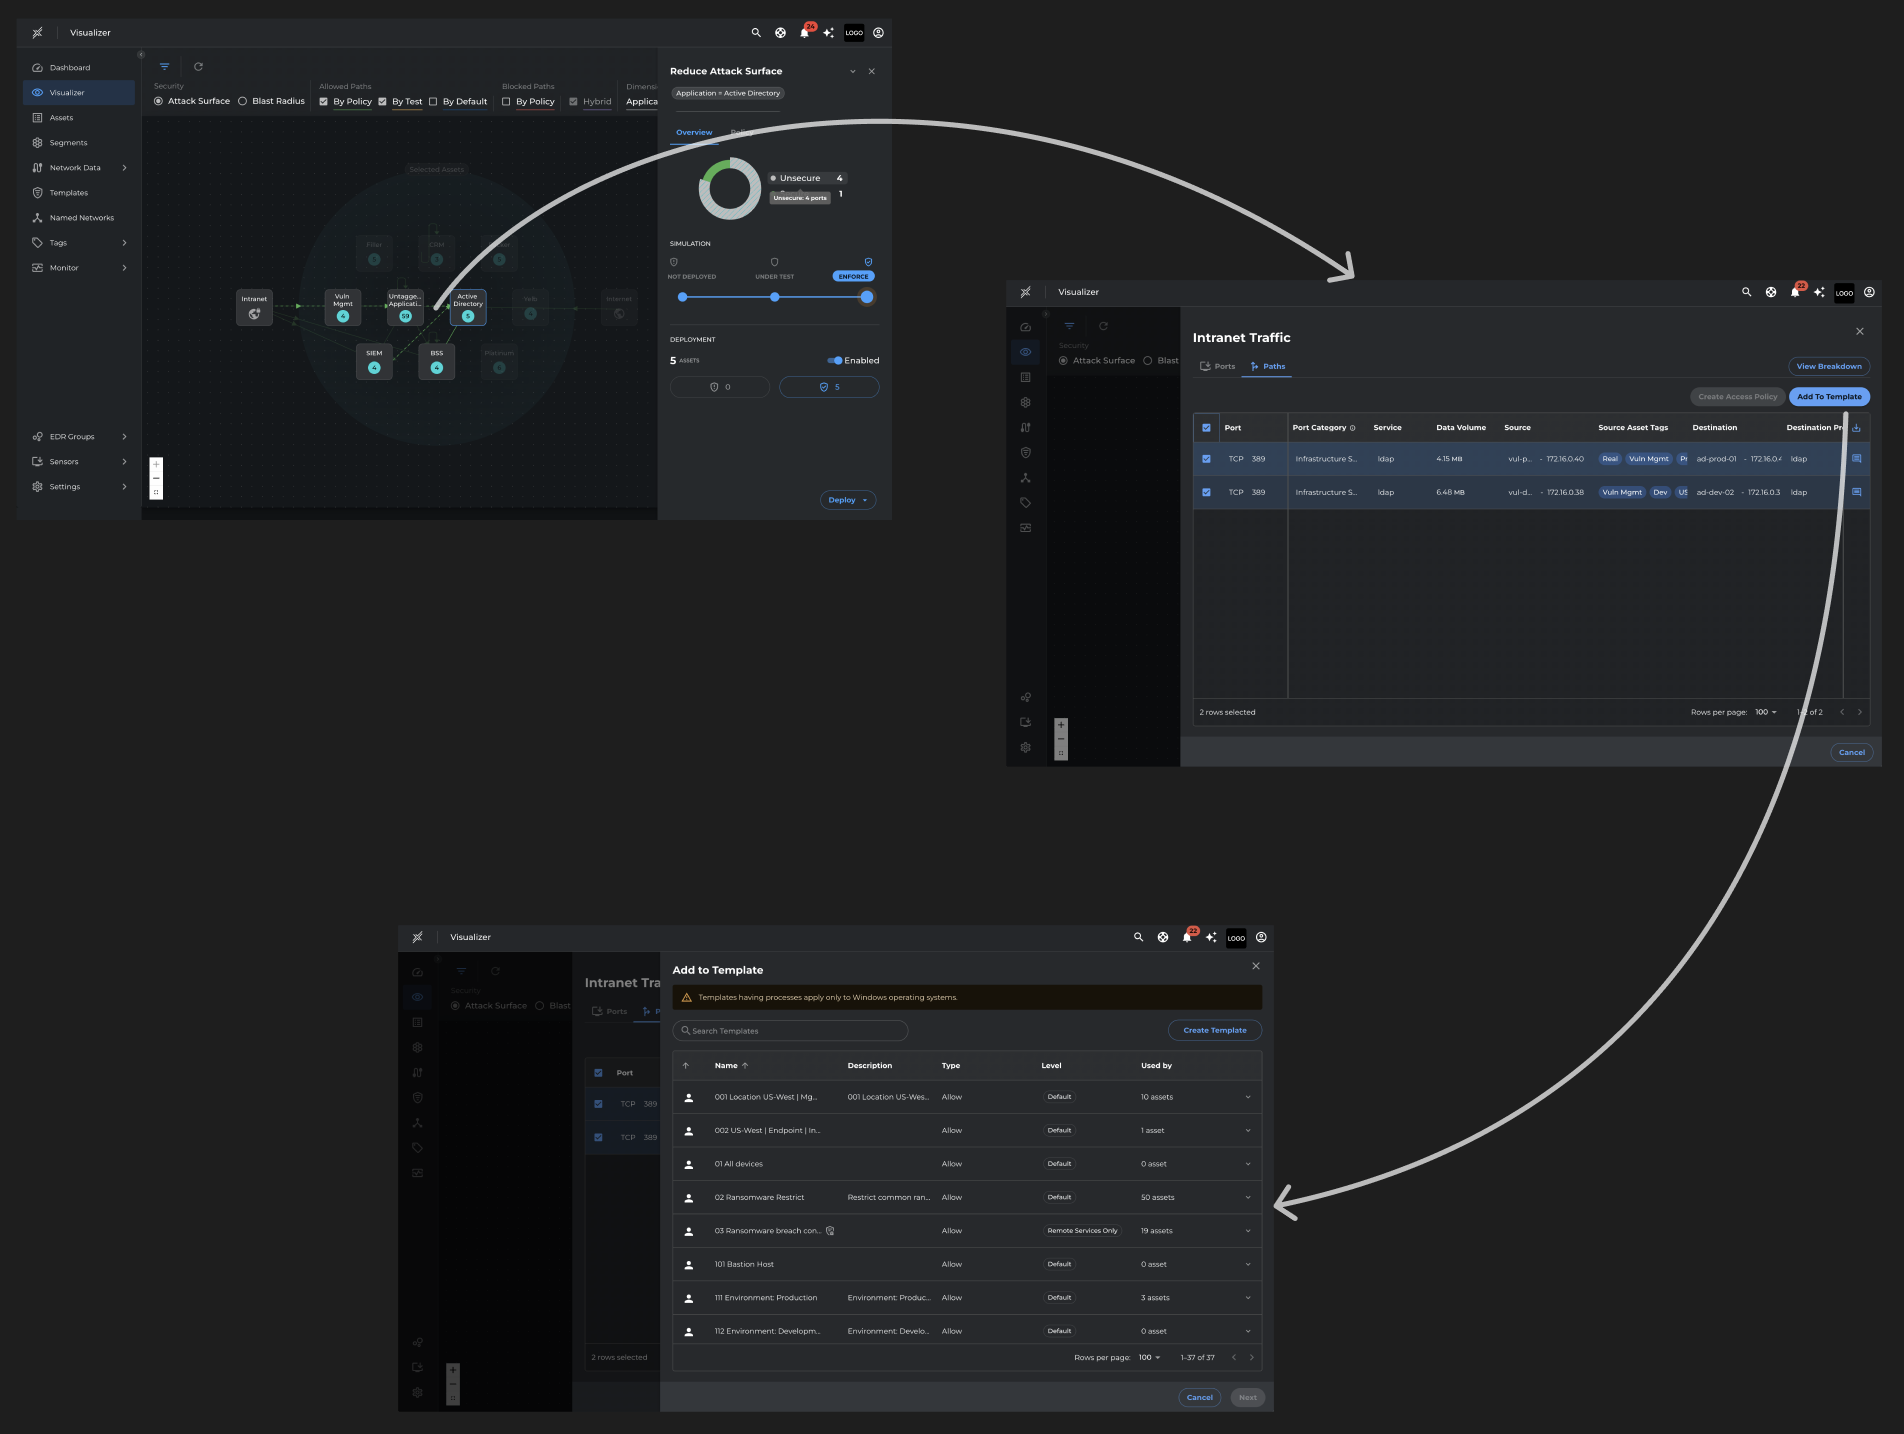
- Visibility of system status – The network map clearly shows Michael which assets are unsecure, guiding him toward action.
- Recognition over recall – Clicking into intranet traffic presents data in a structured table, making it easy to recognize risky connections without digging through logs.
- Consistency and standards – The “Add to Template” step follows the same table design with familiar columns and controls, ensuring a predictable workflow.